
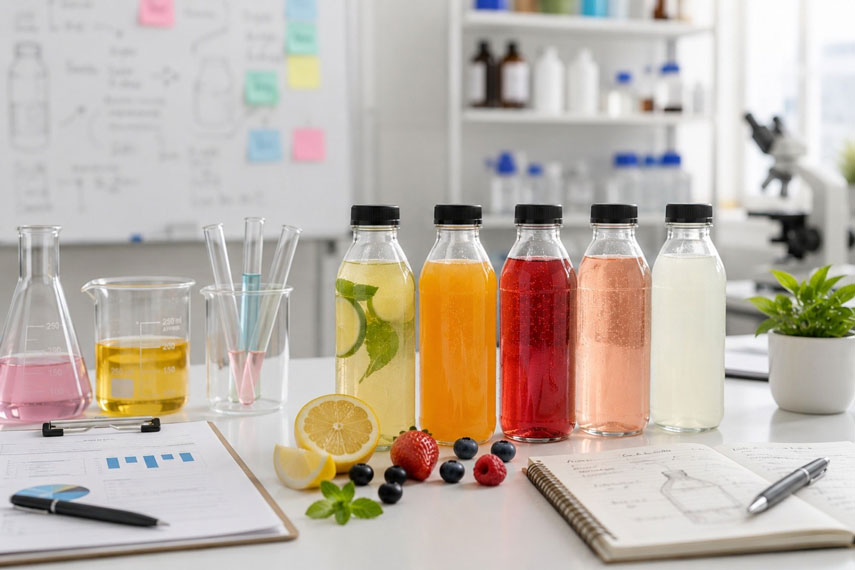
Stage-Gate Process in Beverage Formulation Development: A Practical Overview
Beverage brands often start with a great idea. But turning that idea into a stable, sellable drink takes more than good taste. This is where the Stage-Gate process comes in, giving formulation teams a structured way to move from concept to shelf.
Instead of guessing when a project is ready, teams use clear checkpoints called gates. Each gate forces a real decision: go, kill, hold, or recycle. For beverage companies, this matters even more, since formulation involves pH, sweeteners, stability, and regulatory rules all at once. A single missed step can derail months of work.
What Is the Stage-Gate Process?
The Stage-Gate process was created by Dr. Robert G. Cooper in the early 1990s [1]. It divides product development into distinct stages of work. Between each stage sits a gate, a decision point where leaders review progress [2]. At every gate, senior stakeholders ask a simple question. Should this project continue, stop, wait, or get reworked? Teams know exactly what to deliver before each review. Decision-makers know exactly what to check before approving next steps.
Today, most large food and beverage companies use some version of this model. Benchmarking studies suggest a majority of product development firms rely on structured processes like Stage-Gate [7][8].
Why Beverage Formulation Needs Its Own Lens
General Stage-Gate models were built for physical products broadly. Beverages carry technical quirks that deserve special attention. Water quality, pH, and sweetener systems interact in complex ways. A formula that tastes great in a lab may fail at commercial scale. Shelf stability, packaging compatibility, and regulatory limits vary by market. Because of this, beverage teams often adapt the standard stages. They add checkpoints for stability testing, sensory validation, and scale-up trials.
Stage 1: Concept and Discovery
Every beverage project starts with a clear idea. Good concept work answers a few essential questions early.
Who is the target consumer, and when will they drink it? What format fits best: ready to drink (RTD), powder, concentrate, or carbonated? Which regulatory framework applies, and is multi-market compliance needed? What is the target cost of goods at the intended price point?
A strong concept brief answers these questions upfront, saving weeks of rework later.
At Gate 1, the team checks a few basics: is there a real market opportunity, and any obvious regulatory blockers? A freedom-to-operate check belongs here too, since R&D should screen competitor patents before locking a novel ingredient [5]. If everything holds up, the project earns resources for the next stage.
Stage 2: Feasibility and Ingredient Screening
This stage turns the concept into a technical foundation. Formulators evaluate ingredients on taste, function, solubility, heat stability, and cost, all at once.
Water itself deserves attention, since it often makes up most of the formula. Total alkalinity matters more than hardness alone, especially in carbonated drinks, since it neutralises acids and shifts the acid-to-Brix balance. Common industry practice keeps alkalinity under 50 ppm as calcium carbonate, ideally below 20 ppm.
Sweetener systems need early calibration. Sugar offers clean taste but faces growing consumer resistance. Stevia and monk fruit cut calories but can add bitterness, so blends often work better than one sweetener alone. Zero-sugar formulas built on high-intensity sweeteners sit near zero Brix.
Acid selection shapes both taste and safety. Citric, malic, and lactic acids each create distinct sourness profiles. Phosphoric acid deserves its own mention, since it defines the sharp character in cola-style drinks. Its erosive effect on enamel is lower than citric acid, but dosage still needs care for dental health [11].
pH alone does not guarantee microbial safety. Mould and yeast can still grow below pH 4.0. Preservative-free beverages usually need a pH between 2.5 and 3.5. Formulas closer to pH 4.0 typically need an approved preservative, such as sodium benzoate or potassium sorbate.
Functional ingredients like vitamins or botanicals bring their own dosing challenges. Vitamin C degrades under heat and light, so formulas need an overage built in. Probiotics face a harder path, since live cultures must survive acidic conditions.
Emulsion and hydrocolloid stability deserves early attention too. Flavour emulsions and clouding agents can separate through creaming or sedimentation over time. Hydrocolloids like xanthan gum, paired with weighting agents, keep these systems stable [15].
Clean-label goals belong in this stage as well. Natural colours such as anthocyanins are often sensitive to pH and light in ways synthetic colours are not [12]. This sensitivity should count as a gate criterion.
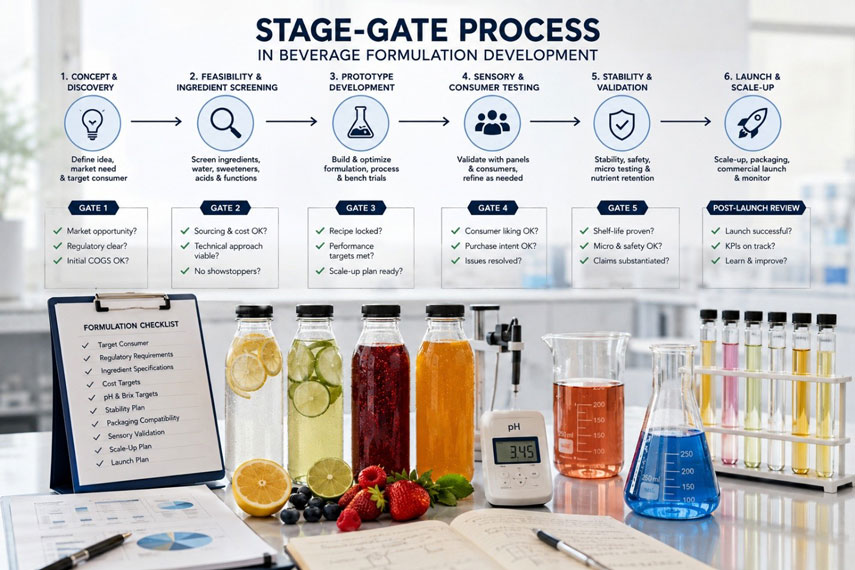
Gate 2 checks whether the sourcing plan, cost estimate, and technical approach hold up.
Stage 3: Prototype Development
Now the real formulation work begins. Teams typically need five to fifteen bench iterations to lock a recipe, depending on complexity and brief quality.
Brix1 determines sweetness perception and mouthfeel. Most sugar-sweetened RTD beverages sit between six and fourteen degrees Brix, though zero-sugar versions run much lower. The acid-to-Brix ratio is often the single most important balance point. Getting it wrong makes the drink taste flat or too sharp.
The processing method should be decided now, not later. Hot-fill, cold-fill with preservative, tunnel pasteurisation, and aseptic processing each stress a formula differently. Aspartame and other heat-sensitive sweeteners can degrade, or flash off their flavour, under hot-fill conditions.
Carbonated formulas add another layer of complexity. Most target between 1.5 and 4.5 volumes of dissolved CO2. Gas solubility and resulting foam behaviour depend heavily on temperature and pressure together [16]. This relationship needs revisiting again during shelf-life validation.
Every iteration should be documented with exact quantities and steps. This documentation becomes the specification the manufacturing team follows later.
Gate 3 confirms the recipe is locked and the prototype performs as intended.
Stage 4: Sensory and Consumer Testing
A technically sound formula still needs to win over real drinkers. Trained panels catch technical flaws using standard methods. A Triangle Test confirms detectable differences. A 9-point hedonic scale measures overall liking [17]. A Just-About-Right, or JAR, scale fine-tunes sweetness.
Consumer testing, done with actual target buyers, reveals purchase intent. Skipping this step is a common and costly mistake. Products that skip it often discover mismatches only after production begins. Regional taste differences matter too, especially for traditional flavour profiles.
Gate 4 checks whether the concept score holds up with real consumers. It also confirms whether earlier technical issues have been resolved.
Stage 5: Stability and Validation
This is the stage most often rushed, and it shouldn’t be. A formula that looks fine on day one may fail by month three, as colour fades or pH drifts.
Accelerated shelf-life testing, at higher temperature and humidity, gives early signals within weeks. Real-time testing at normal storage conditions confirms the final claim. Microbiological testing must cover total counts, yeast, mould, and relevant pathogens, and carbonated products need their own CO2 retention check.
This is also where commercial-scale production trials get planned. A formula validated at ten litres may behave differently at five thousand litres.
Stage 6: Launch and Scale-Up
Once validation passes, the product moves toward full commercialisation. A pilot run typically sits between five and ten percent of full batch size, sometimes smaller. On very large lines it can fall under one percent. This catches scale-up issues before they multiply across a full run.
Packaging choices interact directly with the formula. PET, cans, glass, and cartons each carry different technical constraints. Hot-fill PET needs special bottles, cans need liner compatibility checks, and UHT cartons rule out heat-sensitive ingredients.
Gate 5 confirms logistics, first commercial trial results, and retailer commitments are all in place. A formal post-launch review, usually within ninety days to a year, closes the loop.
Packaging as a Formulation Decision
The container shapes flavour, shelf life, and safety, well beyond just its form or colour.
PET can absorb certain flavour compounds, a problem known as flavour scalping [13][14]. Oxygen and water vapour transmission rates (OTR and WVTR) need testing against the target shelf life. Migration of monomers or plasticisers is another check.
Aluminium cans need compatibility testing between the formula and the can lining, including lacquer corrosion testing for acidic beverages. Skipping these checks can mean a recall months after launch.
These checks form a packaging compatibility checklist, run in Stage 2 or 3 alongside the formulation work, not after it.
Glass avoids oxygen transmission and flavour interaction, but adds weight and fragility. Tetra-style cartons need ultra-high-temperature processing, which can rule out heat-sensitive probiotics and delicate flavours (Table 1).
Table 1: Packaging Format Comparison for Beverage Formulation
| PET bottle | Flavour scalping, OTR/WVTR limits | Ambient RTD drinks, cold-fill |
| Aluminium can | Lacquer corrosion in acidic drinks | Carbonated, high-acid beverages |
| Glass bottle | Minimal, but heavy and fragile | Premium, light-sensitive formulas |
| Aseptic carton | Requires UHT-tolerant ingredients | Dairy or probiotic beverages |
Supply Chain Realities Behind the Formula
Sourcing specialty ingredients is rarely simple. Botanical extracts, hydrocolloids, and speciality emulsifiers, such as PGPR or Span 65, often come from a small pool of suppliers. Certificates of Analysis, and where relevant free-sale documentation, need verifying before any ingredient enters a commercial formula. International lead times can stretch, so teams should map supplier risk and identify a backup source for high-risk ingredients [18].
Where Agility Fits Into Stage-Gate
The classic Stage-Gate model is linear by design, which can slow things down [3]. Rigid, heavily-controlled gates can make a project too inflexible to absorb new information [6]. Many beverage teams now blend it with agile methods, often called Agile-Stage-Gate [4][9][10]. This hybrid keeps the same gates and go, kill, hold, or recycle decisions. Work inside each stage happens in short, rapid iterations instead of one long push.
The Gates: What Actually Gets Checked
Every gate follows a similar structure. Deliverables come first: the specific outputs the team must bring to the meeting. Criteria come next: the metrics used to judge readiness. Output comes last: a clear decision, not a vague status update.
Five outcomes are possible at any gate. Go means the project proceeds with resources. Kill means it ends. Hold means it pauses for a specific reason. Recycle means the team fixes gaps and returns. Conditional go allows progress with follow-up conditions attached (Table2).
Table 2: Gate-by-Gate Deliverables and Decision Criteria
| Gate 1 | Concept brief, target consumer, regulatory scan | Market opportunity, freedom-to-operate |
| Gate 2 | Ingredient list, sourcing plan, cost estimate | Technical feasibility, supply risk |
| Gate 3 | Locked prototype, processing method | Sensory bench performance, documentation |
| Gate 4 | Consumer test results, concept score | Purchase intent, resolved technical issues |
| Gate 5 | Commercial trial data, retailer commitments | Scale-up success, logistics readiness |
Common Pitfalls in Beverage Stage-Gate Projects
Declaring shelf life from accelerated data alone is risky, since real-time data sometimes reveals degradation the model missed.
Assuming a pilot-scale process transfers directly to commercial lines is another trap. Different equipment and flow rates change outcomes unpredictably.
Treating packaging as a branding decision made after the formula is locked causes real problems. Skipping regulatory checks until late is also costly.
A home recipe is not a full product brief. It tells you how a drink should taste, but says nothing about stability, scalability, or compliance.
Matching Process Intensity to Project Risk
Not every beverage project needs the full five-gate treatment. High-complexity projects, like a new product with novel ingredients, deserve all five gates. Medium-complexity projects, like a new flavour on an existing platform, can merge some gates. Low-complexity changes may only need a single feasibility check.
Why This Framework Works
The evidence behind Stage-Gate is not just theoretical. Benchmarking studies show most product development firms use some version of it. Companies report shorter cycle times and stronger early detection of problems [7][8]. For beverage formulation, the added technical checkpoints protect against costly late-stage failures.
A Quick Worked Example
Picture a brand launching a sparkling functional drink across two countries. At Gate 1, one ingredient is flagged as borderline under Novel Food rules and parked. At Gate 2, the manufacturing method and co-packer get locked within the margin target.
At Gate 3, a can-liner compatibility issue surfaces, and the team swaps to an alternative liner. At Gate 4, production trials confirm the process at commercial scale. At Gate 5, the first commercial trial is approved and the product launches on schedule.
Cross-Functional Roles at Each Gate
R&D owns the technical brief and shelf-life data. Regulatory affairs owns claim substantiation, and quality assurance owns microbiological validation. Operations owns sourcing and capacity, finance owns the cost model, and marketing owns the launch plan.
The most common failure happens when one team assumes another is handling a deliverable. Clarifying ownership at the first kick-off meeting prevents most of these gaps.
How Long Does Beverage Formulation Actually Take?
Timelines vary widely depending on product complexity and the number of markets involved. The table below gives rough ranges from concept to a locked formula (Table 3).
Table 3: Typical Development Timelines by Product Type
| Flavoured water, basic sports drink | 8-14 weeks |
| Energy drink, herbal RTD | 12-20 weeks |
| Functional beverage, multiple actives | 16-28 weeks |
| Probiotic or fermented beverage | 20-36 weeks |
| Export market or novel ingredient | 24-40+ weeks |
Regulatory review across multiple countries is usually the biggest driver of the longer timelines above.
Documentation That Actually Protects the Business
A commercially ready formula is more than a list of ingredients. Complete documentation includes ingredient specifications and the formula at commercial batch weight. It also covers processing parameters, in-process checkpoints, finished specifications, shelf-life data, and the regulatory compliance file. This is what allows a formula to be manufactured consistently across teams.
Using Data to Support Gate Decisions
Gate decisions work best when they rest on real data, not gut feeling. Concept scores, sensory results, purchase-intent numbers, cost estimates, and risk registers all belong at gate reviews. Teams relying only on anecdotal feedback tend to make weaker go or kill calls.
Some companies now track this information on a shared dashboard instead of scattering it across spreadsheets. Whatever the tool, the principle stays the same: bring evidence, not opinions, to every gate.
Getting Started
Teams new to Stage-Gate don’t need a complex system on day one. Start with clear stage definitions and honest gate criteria, and involve cross-functional voices from the first stage. Document every formulation decision, even small ones, and refine the process over time.
Small brands benefit from this discipline as much as large ones. A founder-led team can run a lightweight version with the same core structure, simplifying the paperwork and shortening the meetings.
Conclusion
Beverage formulation is equal parts art and science. Stage-Gate doesn’t replace creativity, but it gives that creativity a reliable path to market. From concept brief to commercial launch, each stage builds on the last. Each gate protects the business from costly mistakes.
Frequently Asked Questions (FAQ)
What is the Stage-Gate process in beverage formulation?
It is a structured framework that breaks development into stages and gates. Each gate is a decision point where leaders choose to continue, stop, pause, or rework the project.
How many stages does a typical beverage Stage-Gate process include?
Most teams use five or six stages, covering concept, feasibility, prototype, sensory testing, validation, and launch. Companies often merge stages for simpler, lower-risk projects.
Why is stability testing so important in beverage development?
A formula can look and taste perfect on day one. By month three, colour, flavour, or safety can all shift, so testing must catch problems early.
What happens at a Stage-Gate gate review?
Gatekeepers review deliverables against clear criteria, then choose one outcome: go, kill, hold, recycle, or conditional go.
Can small beverage brands use a simplified Stage-Gate process?
Yes. A lightweight version keeps the same stages and gate questions, just with less paperwork and shorter meetings.
References
1. Cooper, R.G. (1990). Stage-Gate systems: A new tool for managing new products. Business Horizons, 33(3), 44-54.
2. Cooper, R.G. (2008). Perspective: The Stage-Gate idea-to-launch process — update, what’s new, and NexGen systems. Journal of Product Innovation Management, 25(3), 213-232.
3. Cooper, R.G. (2014). What’s next? After Stage-Gate. Research-Technology Management, 57(1), 20-31.
4. Cooper, R.G. (2017). Idea-to-launch gating systems: Better, faster, and more agile. Research-Technology Management, 60(1), 48-52.
5. Grönlund, J., Sjödin, D.R., & Frishammar, J. (2010). Open innovation and the Stage-Gate process: A revised model for new product development. California Management Review, 52(3), 106-131.
6. Sethi, R., & Iqbal, Z. (2008). Stage-gate controls, learning failure, and adverse effect on novel new products. Journal of Marketing, 72(1), 118-134.
7. Barczak, G., Griffin, A., & Kahn, K.B. (2009). Perspective: Trends and drivers of success in NPD practices: results of the 2003 PDMA best practices study. Journal of Product Innovation Management, 26(1), 3-23.
8. Knudsen, M.P., Von Pedowitz, M., Griffin, A., & Barczak, G. (2023). Best practices in new product development and innovation: Results from PDMA’s 2021 global survey. Journal of Product Innovation Management, 40(3), 257-275.
9. Cooper, R.G., & Sommer, A.F. (2016). The Agile–Stage-Gate hybrid model: A promising new approach and a new research opportunity. Journal of Product Innovation Management, 33(5), 513-526.
10. Cooper, R.G., & Sommer, A.F. (2018). Agile–Stage-Gate for Manufacturers: Changing the Way New Products Are Developed Integrating Agile project management methods into a Stage-Gate system offers both opportunities and challenges. Research-Technology Management, 61(2), 17-26.
11. West, N.X., Hughes, J.A., & Addy, M. (2001). The effect of pH on the erosion of dentine and enamel by dietary acids in vitro. Journal of Oral Rehabilitation, 28(9), 860-864.
12. Malien-Aubert, C., Dangles, O., & Amiot, M.J. (2001). Color stability of commercial anthocyanin-based extracts in relation to the phenolic composition. Journal of Agricultural and Food Chemistry, 49(1), 170-176.
13. Sajilata, M.G., Savitha, K., Singhal, R.S., & Kanetkar, V.R. (2007). Scalping of flavors in packaged foods. Comprehensive Reviews in Food Science and Food Safety, 6(1), 17-35.
14. Sadler, G.D., & Braddock, R.J. (1990). Oxygen permeability of low density polyethylene as a function of limonene absorption: An approach to modeling flavor “scalping”. Journal of Food Science, 55(2), 587-588.
15. Taherian, A.R., Fustier, P., & Ramaswamy, H.S. (2007). Effects of added weighting agent and xanthan gum on stability and rheological properties of beverage cloud emulsions formulated using modified starch. Journal of Food Process Engineering, 30(2), 204-224.
16. Gonzalez Viejo, C., Torrico, D.D., Dunshea, F.R., & Fuentes, S. (2019). Bubbles, Foam Formation, Stability and Consumer Perception of Carbonated Drinks: A Review of Current, New and Emerging Technologies for Rapid Assessment and Control. Foods, 8(12), 596.
17. Peryam, D.R., & Pilgrim, F.J. (1957). Hedonic scale method of measuring food preferences. Food Technology, 11, 9-14.
18. Diabat, A., Govindan, K., & Panicker, V.V. (2012). Supply chain risk management and its mitigation in a food industry. International Journal of Production Research, 50(11), 1-12.